
Introduction
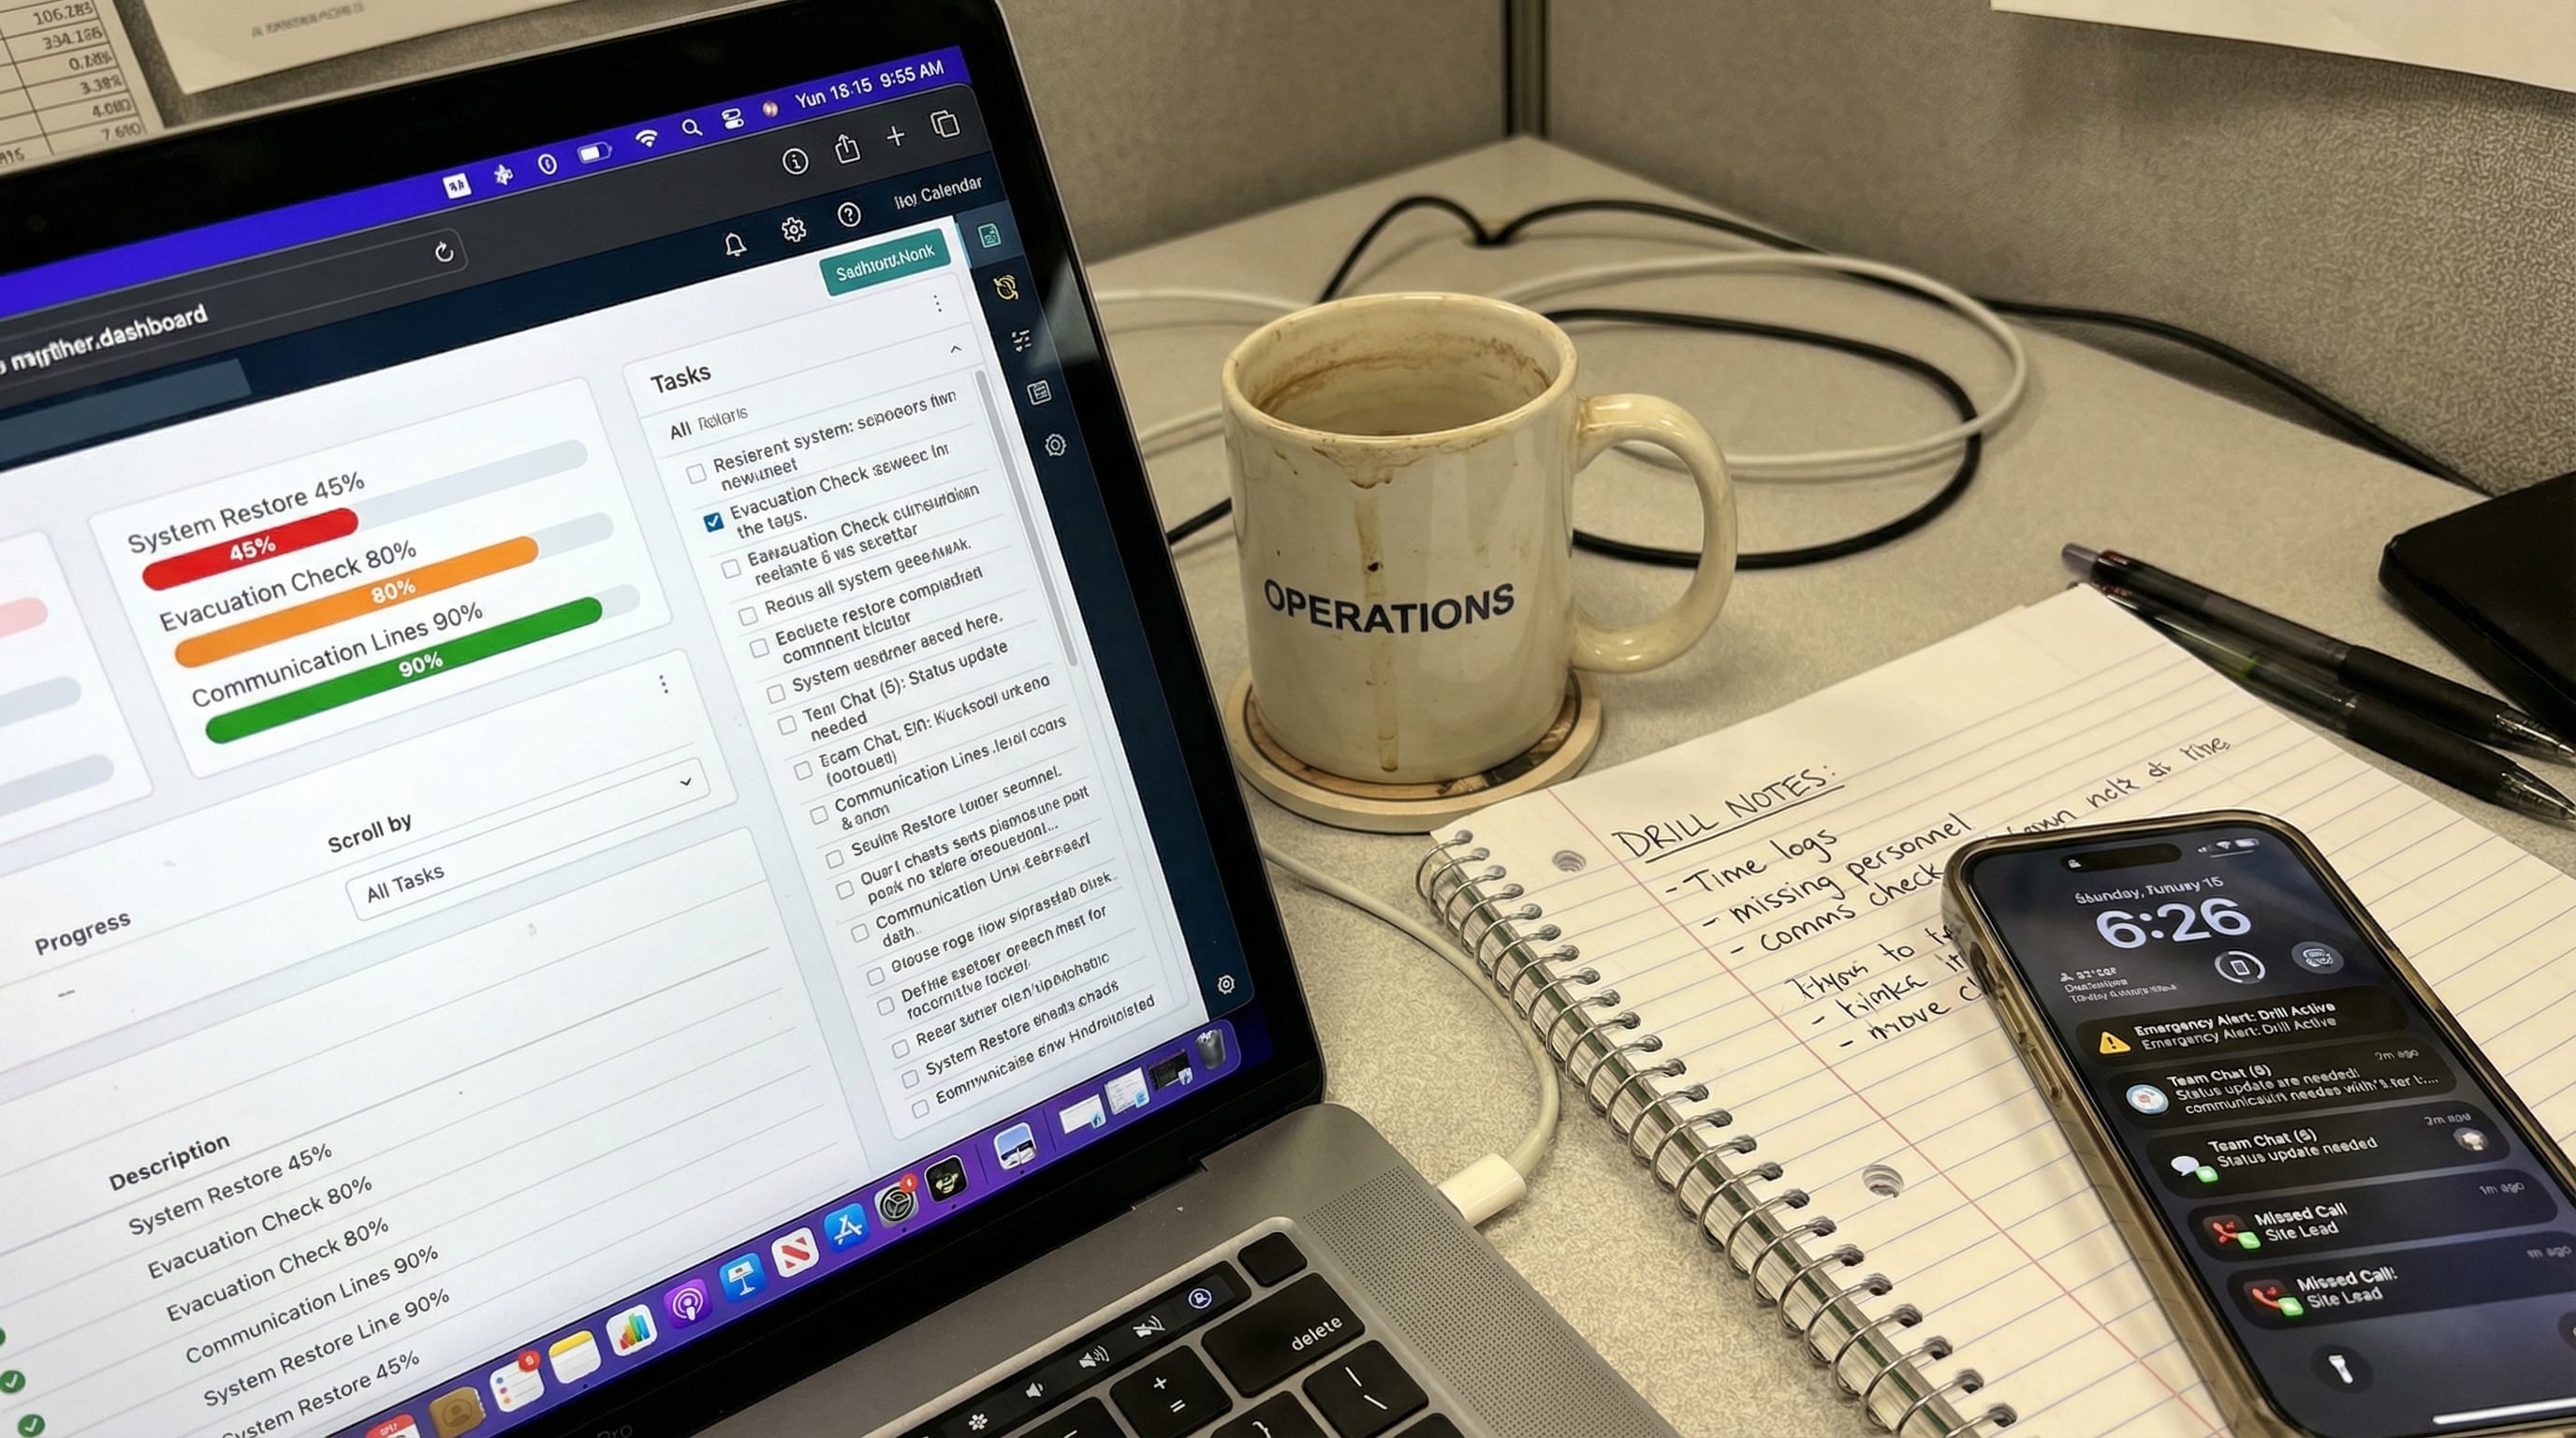
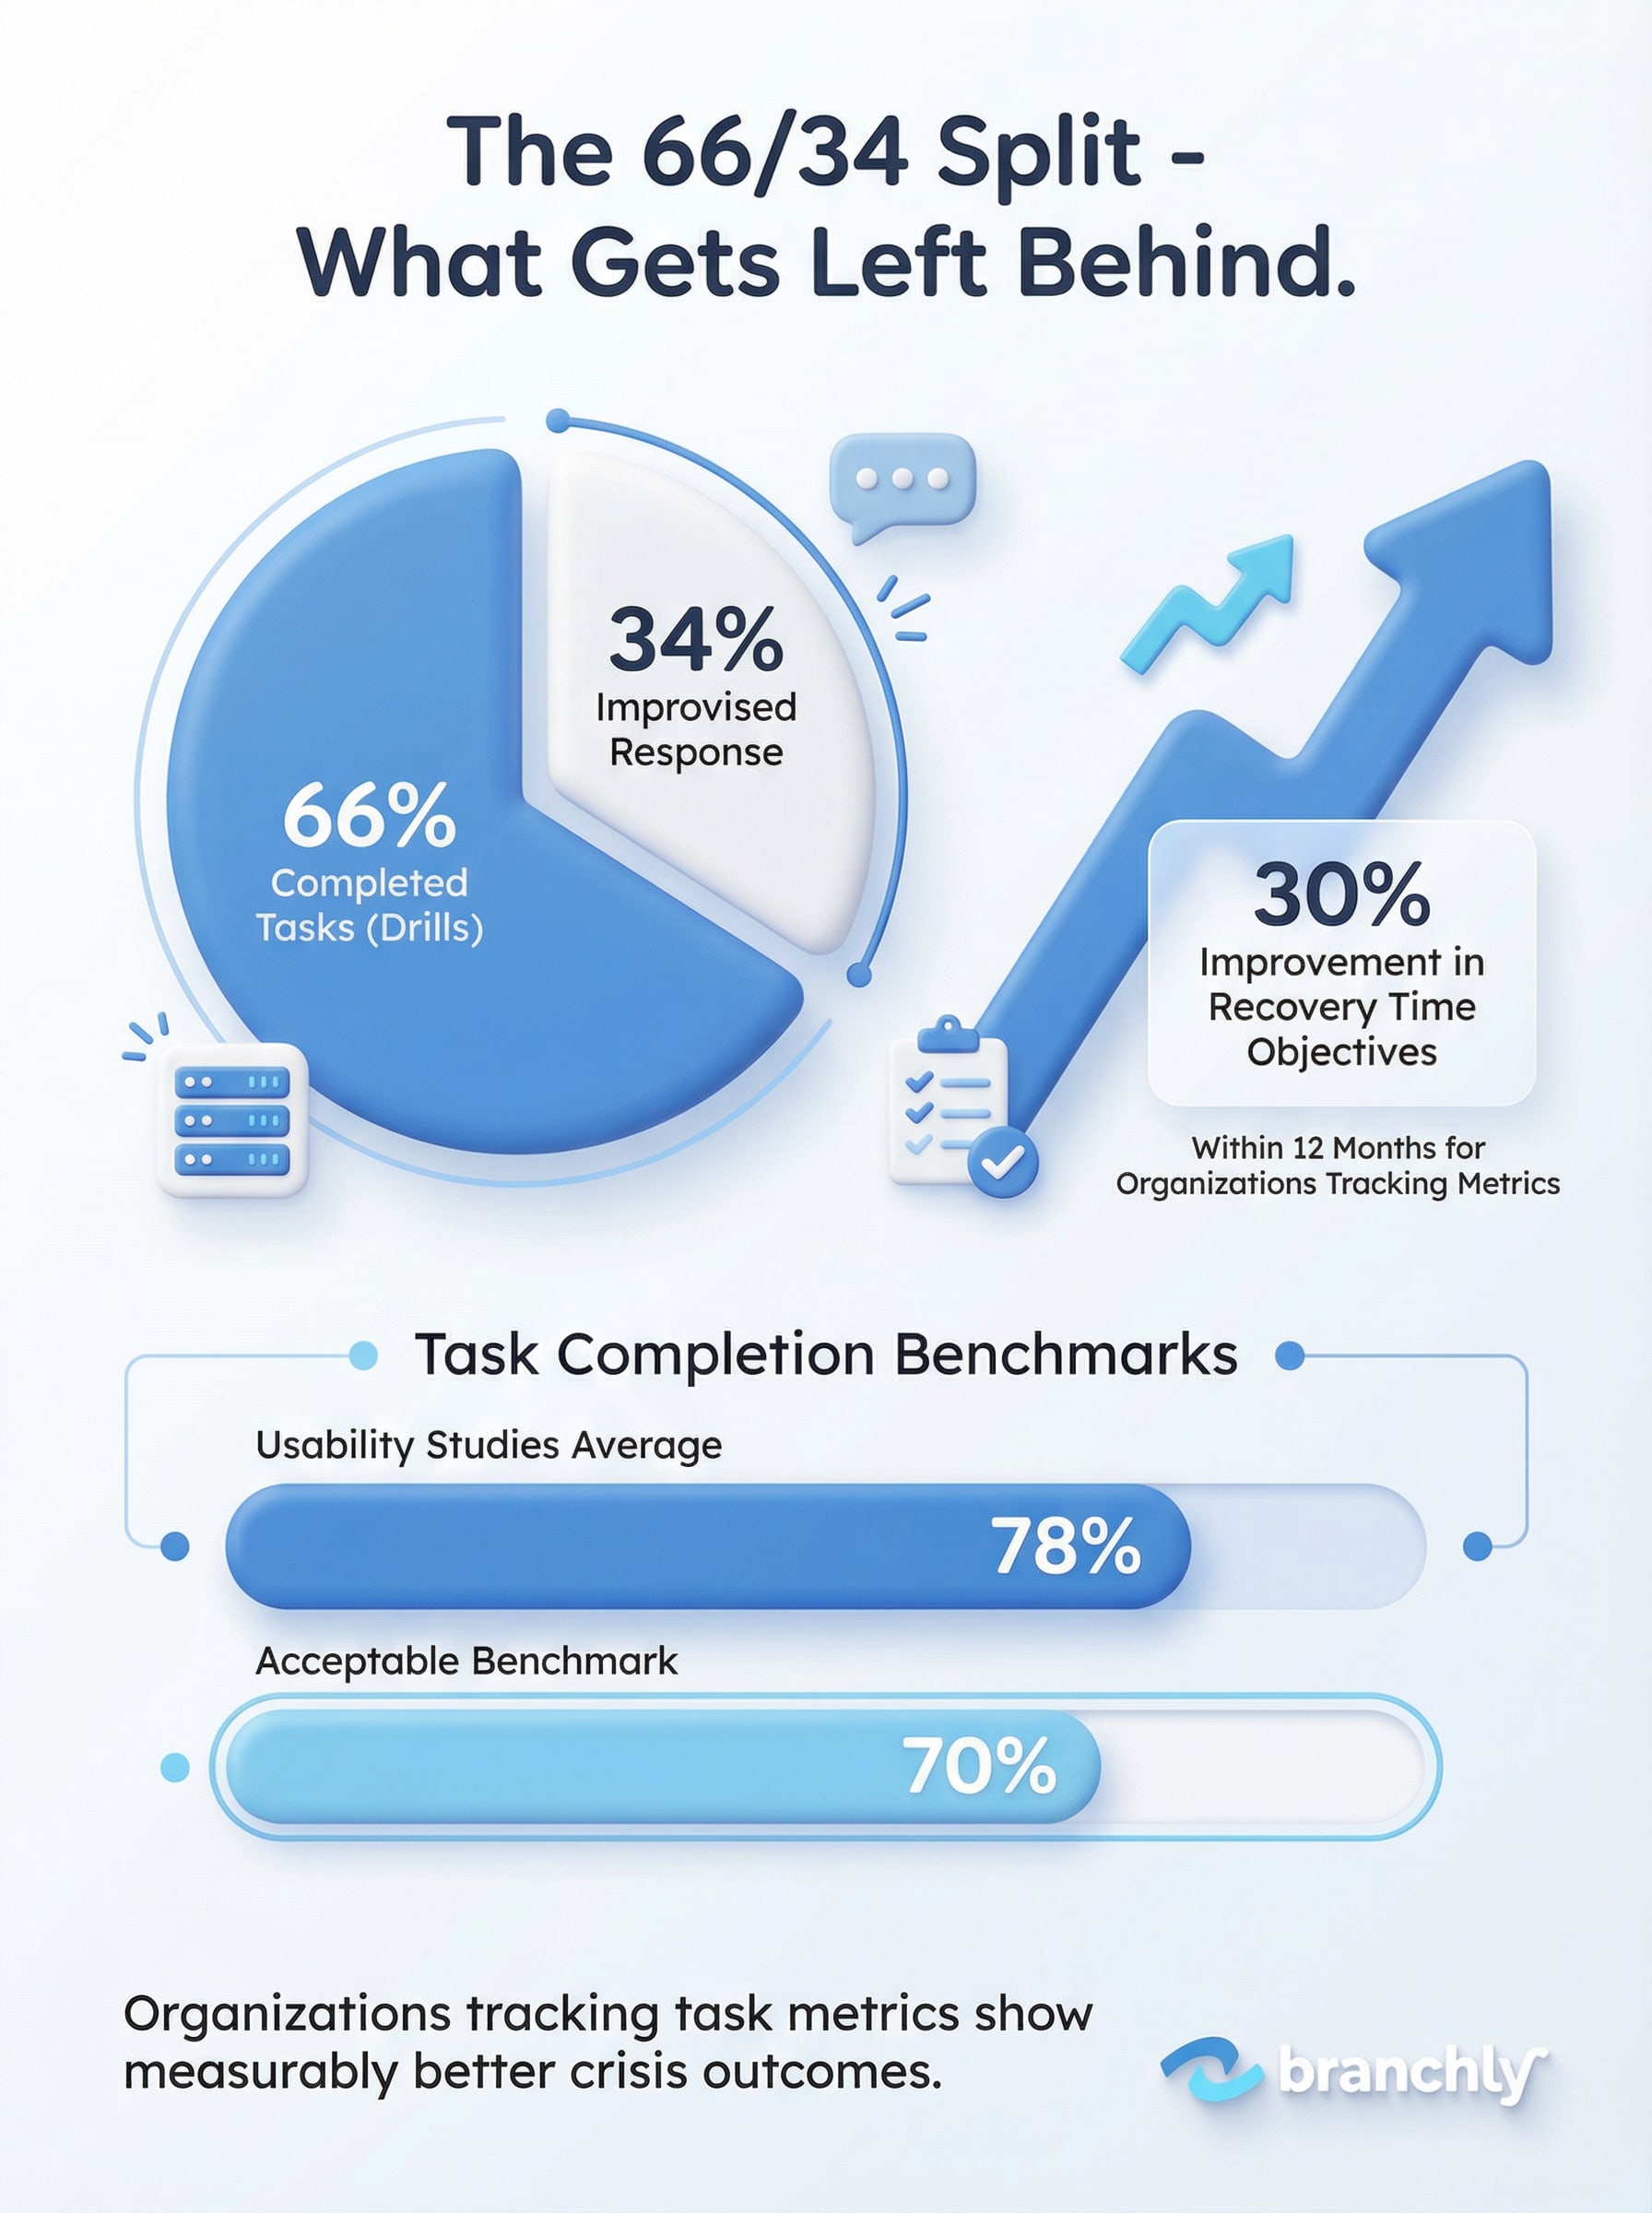
Your crisis plan includes 47 steps for a ransomware attack. During your last tabletop exercise, your team completed 31 of them in the allotted time. That's a 66% task completion rate, and it means people will be improvising the final third of your response when systems are actually down and customers are calling.
Task completion metrics don't just measure speed. They expose where protocols break down, which roles lack clarity, and which steps need rethinking. Organizations that track these numbers see an average 30% improvement in recovery time objectives within 12 months. More important, they stop guessing about what actually works when pressure hits.
Why Most Crisis Plans Look Better Than They Perform
A 200-page business continuity plan sitting in SharePoint feels reassuring. But comprehensive documentation doesn't equal executable process. The difference becomes obvious when you measure what percentage of planned tasks your team can actually finish during a drill or real incident.
Research across usability studies shows the average task completion rate is 78%, with 70% considered acceptable for consumer applications. But crisis response isn't a consumer app. When your core banking system goes down, a 70% completion rate means critical notifications don't get sent, backup systems don't activate, or regulatory reports don't get filed.
The problem isn't usually lack of effort. It's that plans get written in ideal conditions and tested in controlled environments. Real incidents introduce variables: key people are unreachable, systems behave unexpectedly, information arrives incomplete. Task completion metrics reveal which parts of your plan survive contact with reality and which parts need redesign.
Quick Win
Track completion rates separately for notification tasks, technical recovery tasks, and communication tasks. Different categories fail for different reasons and need different fixes.
What Task Completion Rates Actually Tell You
Low completion rates point to specific failure modes. A task that 90% of teams skip or abandon reveals a procedural problem, not a training gap. When the same tasks consistently don't get finished across multiple drills, you're looking at systematic issues in your plan design.
Common patterns include tasks with unclear ownership, steps that require information not yet available at that stage of response, and procedures that assume technical access people don't have. A regional bank discovered their backup verification process had a 45% completion rate because it required VPN access that field managers couldn't get during off-hours. The task wasn't hard. The plan was poorly sequenced.
Quality matters as much as speed. Tracking error rates and rework requirements shows whether tasks get finished correctly or just checked off. A hotel chain found their 85% completion rate masked a 40% error rate in guest notification messages. Tasks were being completed, but half needed redoing because templates didn't account for different scenarios. Completion without quality creates false confidence.
By the Numbers
Organizations with strong analytics capabilities are 23% more likely to achieve superior business continuity outcomes, according to McKinsey research on crisis preparedness.
Building Historical Baselines That Drive Improvement
One drill tells you where you are today. Six months of drill data tells you whether you're getting better or just getting familiar with the same broken processes. Historical performance tracking turns subjective feelings about preparedness into objective trend lines.
Start by logging completion rates for every major task category across each test or activation. Track Recovery Time Objective achievement, Recovery Point Objective gaps, and incident resolution duration. Compare results quarter over quarter. A credit union that implemented this approach found their RTO improved 30% over 12 months, not because they hired more staff, but because they systematically removed low-value steps and clarified ownership on high-impact tasks.
Statistical analysis of this data reveals patterns individual drills can't show. If notification tasks consistently take 40% longer than planned, your communication tree has structural problems. If technical recovery completion drops on weekends, your on-call coverage model needs work. If specific locations show persistently lower completion rates, they need different training or different procedures.
The goal isn't 100% completion of every task in every scenario. Some tasks become unnecessary as situations develop. The goal is understanding which incompletions represent acceptable adaptation and which represent failures you need to fix.
Watch For This
If completion rates stay flat or decline over time, teams are likely abandoning ineffective procedures rather than reporting problems up the chain. That's a culture issue, not a training issue.
How Testing Reveals What Documentation Hides
Annual plan reviews let you fix typos and update phone numbers. They don't tell you whether people can actually execute the plan under stress. Testing with completion tracking does. Organizations that run quarterly drills and measure results find hidden problems their annual audits miss.
Tabletop exercises work well for testing decision-making and communication flow. But they produce optimistic completion estimates because participants aren't dealing with actual system constraints. Functional drills that require real actions in real systems produce more honest data. A franchise network discovered their store closure procedure had an 82% completion rate in tabletop tests but only 61% in functional drills because actual POS systems required steps the plan didn't document.
Document what happens during each test: which tasks took longer than expected, where people got stuck, what information they needed but couldn't access. This qualitative context explains the quantitative metrics. It also builds institutional memory that survives staff turnover.
Response time tracking adds another dimension. If a task has a 90% completion rate but takes three times longer than planned, your timeline assumptions are wrong. That matters when subsequent tasks depend on its completion. One utility company found their vendor notification process had good completion but terrible timing. By the time vendors were notified, the window for same-day service had closed.
Turn Metrics Into Action
Track completion, identify patterns, fix what fails
Connecting Task Performance to Organizational Resilience
Research on organizational resilience identifies four key drivers: resiliency management, learning capacity, business continuity capabilities, and operational flexibility. Task completion metrics feed directly into three of these four. Organizations that track completion data systematically score higher on composite resilience indexes.
The connection is straightforward. High task completion rates during tests indicate your plans are executable, which means your business continuity capabilities are genuine rather than theoretical. Analyzing completion patterns builds learning capacity by revealing what works and what doesn't. Using that analysis to refine procedures demonstrates resiliency management.
This matters for regulated industries facing audit scrutiny. Showing auditors a document that says you have a plan is table stakes. Showing them completion data from quarterly tests that demonstrate continuous improvement is evidence of actual preparedness. After Robinhood's $57 million FINRA fine for operational failures, regulators care more about demonstrated capability than documented intention.
Real-World Impact
A Disaster Recovery Tracking Tool study found that organizations using structured metrics across 84 tracking points showed measurably faster recovery and better resource allocation than those relying on general assessments.
What to Do With the Data You Collect
Collecting metrics without acting on them wastes time and trains people to ignore testing. The point of measurement is improvement. After each drill or incident, review completion data with three questions: What didn't get finished? Why didn't it get finished? What needs to change?
Common fixes include removing unnecessary steps, reordering tasks to match actual information flow, clarifying role assignments, and pre-positioning required access or resources. A retail chain with 200 locations cut their incident response time by 35% by removing 12 steps that testing showed added no value but consumed significant time.
Share results with the people doing the work. If a specific task shows low completion across multiple tests, ask the people assigned to it what's getting in their way. They usually know. They just need permission to say the procedure doesn't work as written.
Use analytics tools to visualize trends. Dashboards that show completion rates by task category, location, or time period make patterns obvious that spreadsheets hide. Tools like Tableau and Power BI work for organizations with data teams. Simpler solutions include good old Excel charts reviewed consistently in operations meetings.
Implementation Tip
Start with 5-10 critical tasks rather than trying to track everything. Get good data on what matters most, then expand tracking as the practice matures.
From Reactive Logging to Predictive Intelligence
Advanced analytics takes completion data beyond reactive assessment into predictive territory. Machine learning algorithms trained on historical patterns can flag likely failure points before they occur. If similar scenarios in the past showed low completion on specific task types, the system can recommend additional resources or alternate procedures proactively.
This level of sophistication makes sense for organizations managing many locations or frequent incidents. A hospitality company with 400 properties uses completion data from past weather events to predict which locations will need support during incoming storms based on their historical performance patterns. That allows preemptive resource positioning rather than reactive scrambling.
Even without machine learning, simple pattern recognition helps. If weekend incidents consistently show lower completion rates, scheduling practices need attention. If new locations perform worse than established ones in their first six months, onboarding needs work. The data shows you where to look.
Summary
Task completion metrics transform crisis management from hopeful planning to evidence-based preparation. They reveal which procedures work under pressure and which collapse when tested. Organizations that measure completion rates, analyze historical patterns, and act on the results see measurable improvements in response times and recovery objectives. More important, they build confidence that when real incidents hit, their teams can execute the plan rather than improvise around its gaps. The question isn't whether to track these metrics. It's how soon you can start.
Key Things to Remember
- ✓Task completion rates below 80% indicate systematic plan design problems, not training gaps or individual performance issues.
- ✓Historical tracking of completion metrics reveals patterns individual drills can't show and enables 30% average improvement in recovery times.
- ✓Quality matters as much as speed: track error rates and rework requirements alongside completion to ensure tasks finish correctly.
- ✓Functional drills produce more honest completion data than tabletop exercises because they test against actual system constraints.
- ✓Organizations that track task metrics systematically score higher on composite resilience indexes and show better audit outcomes.
How Branchly Can Help
Branchly's Intelligence Layer automatically tracks task completion across drills and real incidents, building historical baselines without manual logging. The system analyzes response times, identifies consistently skipped steps, and surfaces bottlenecks through visual dashboards. After every activation, it suggests removing ineffective tasks, reordering procedures, or refining timing based on actual performance data. This continuous feedback loop turns every incident into a learning opportunity and every drill into measurable progress toward stronger resilience.
Citations & References
- [1]
- [2]
- [3]
- [4]
- [5]
- [6]
- [7]Business Continuity Management: Lifecycle Stages and 6 Best Practices - Faddom faddom.com View source ↗
- [8]05.07. Business Continuity Management and Disaster Recovery Preparedness – Auditing Information Systems pressbooks.pub View source ↗
- [9]Top 5 IT Disaster Recovery Metrics Every Systems Administrator Should Know | CompTIA Blog comptia.org View source ↗